Cultural and Creative Industries Stats – Q1 2025 26
// event // investment // The Big Creative UK Summit
We know that the economic contribution of the creative industries is significant – and growing all the time.
At Creative UK, we are committed to monitoring the sector’s impact and making the data easier to access, understand and use for our network – so that we can keep advocating for more investment in creativity, and championing the work of our extraordinary members and partners.
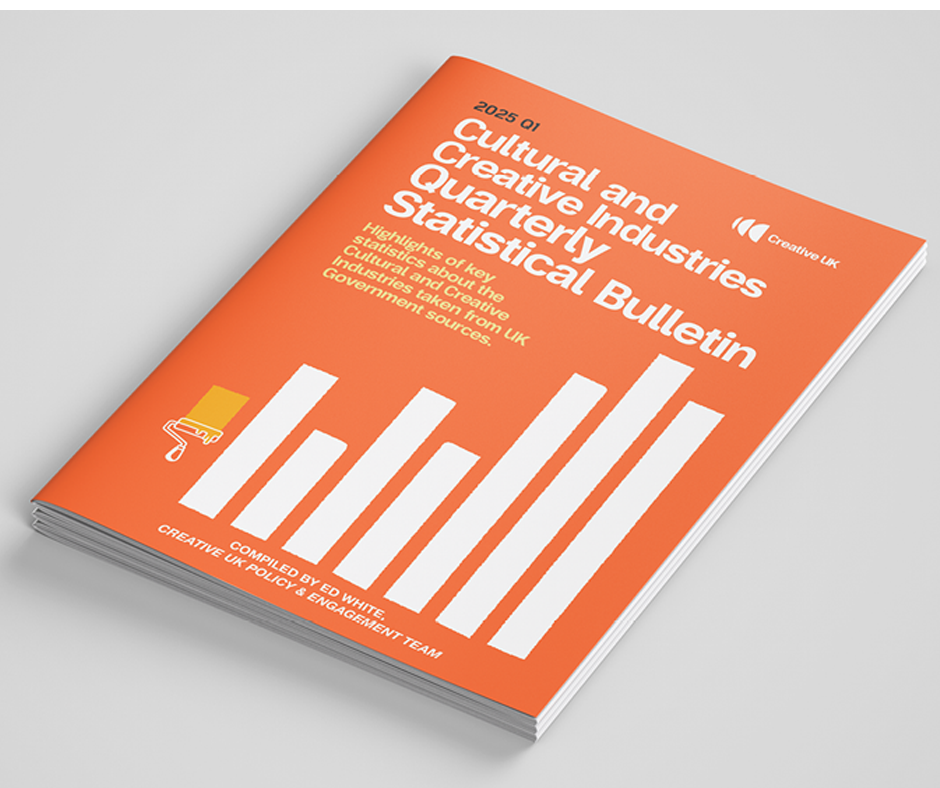
As part of this, our Policy team has created our new Quarterly Statistical Bulletin, a valuable resource that collates up-to-date figures in one place – helping our members to quickly find the evidence they need to advocate for the recognition they deserve.
The full report is designed exclusively for our members who can download it from our members portal.
In this blog we pull out some of the most compelling statistics from the cultural and creative industries that have been compiled in the bulletin. Read on to get a flavour of the stories coming out of the creative industries, as told by the data.
To find out more about becoming a member, visit our sign-up page.
Scroll for a round-up of some of those statistics from across all creative sub-sectors.
Source: GVA (gross value added to the UK economy) for the Cultural and Creative Industries | Source: DCMS Economic Estimates: Monthly GVA (to December 2024)
Sources:
Overall number of Creative and Cultural businesses in the UK | Source: ONS IDBR (Inter-Departmental Business Register) Activity, Size and Location (March 2024 Cut)
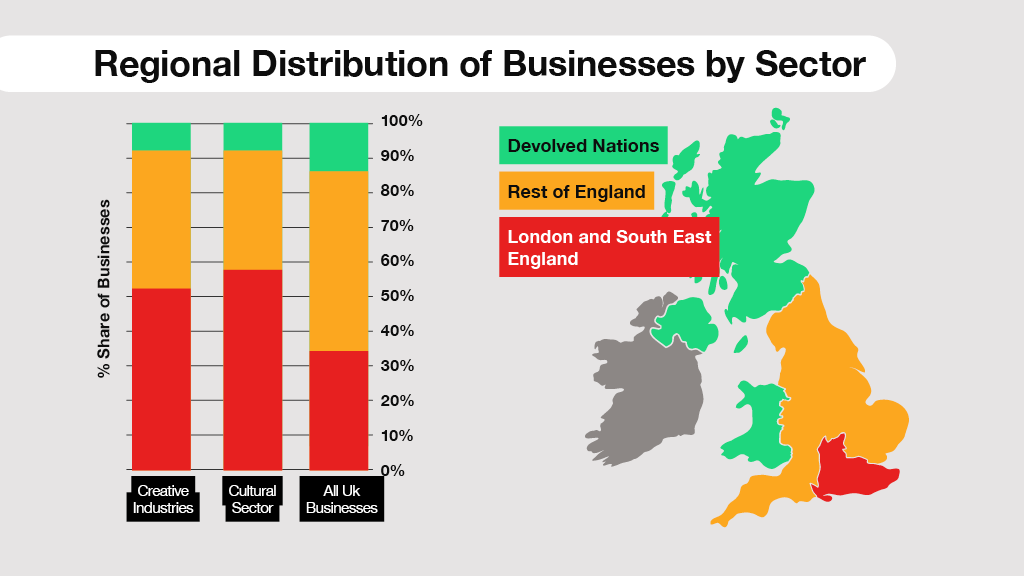
Number of creative businesses in the UK by region | Source: ONS IDBR (InterDepartmental Business Register) Activity, Size and Location (March 2024 Cut)
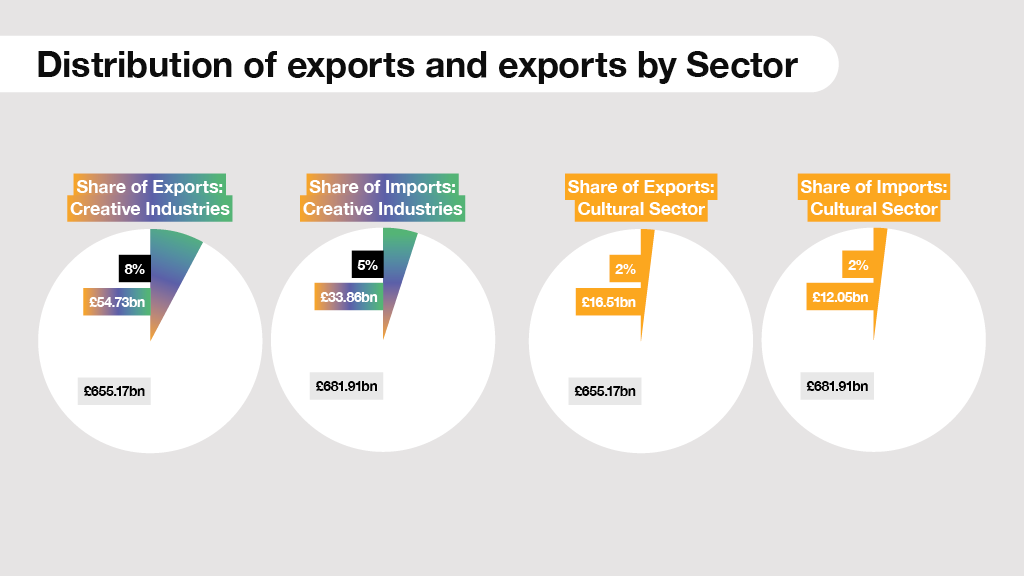
Source: Creative Industries Trade (Goods and Services, 2021) | Sources: DCMS and digital sector economic estimates: Trade (2021)
The Cultural and Creative Industries are a diverse workforce, with a higher proportion of self-employed workers compared to the wider UK workforce. Despite recording higher than average median hourly earnings, the sectors have greater pay inequality across all demographic markers.
Source: Employment within the Creative and Cultural Industries (including self-employment) | Source: Economic Estimates: Employment in DCMS sectors (July 2023 to June 2024)
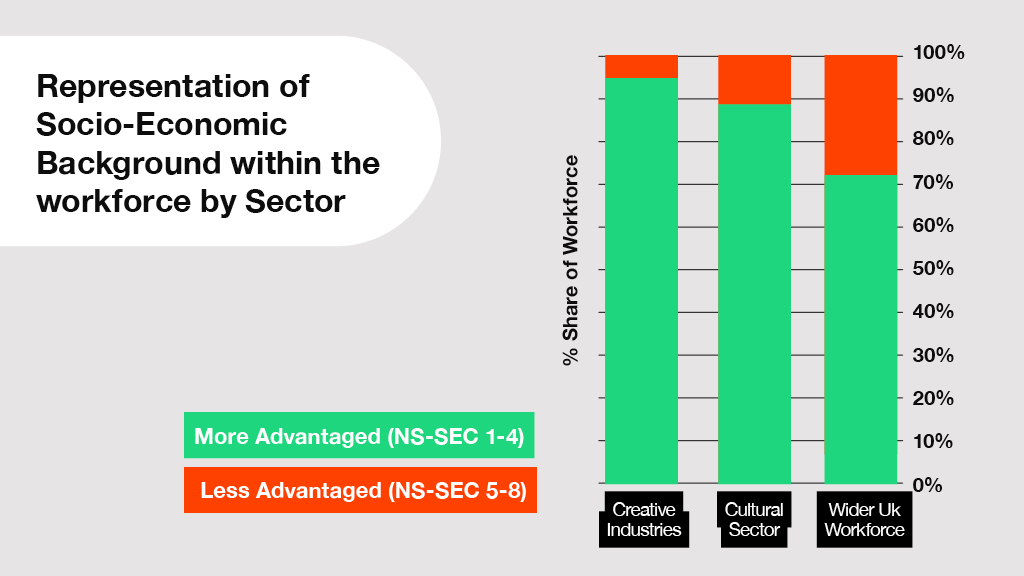
Source: Demographic representation within employment across the Creative and Cultural Industries | Source: Economic Estimates: Employment in DCMS sectors (July 2023 to June 2024)
*More advantaged socio-economic groups are defined as 1-4 on the National Statistics Socio-Economic Classification scale; less advantaged socio-economic groups are defined as 5-8 on the same scale. ONS (No Date) The National Statistics Socio-economic classification (NS-SEC). Available at: https://www.ons.gov.uk/methodology/ classificationsandstandards/otherclassifications/ thenationalstatisticssocioeconomicclassificationnssecrebasedonsoc2010
The full version of our quarterly statistics bulletin on the creative and cultural industries is available for Creative UK members. To learn more about joining Creative UK membership, visit our sign-up page.